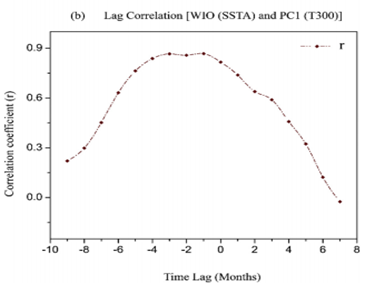
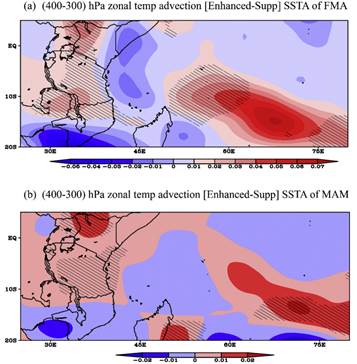
本研究诊断了与坦桑尼亚1980-2010年3-5月暴雨事件相关的高空暖温异常(UWTA,the first EOF mode of the mean MAM 300 hPa temperature anomaly over study area)的成因。从空间分布上看,UWTA覆盖了整个研究区域,主要的暖异常在区域中、北部地区。3-5月UWTA和西印度洋区域海温异常(WIO-SSTA)有一致的变化趋势(图1),两者之间的超前滞后相关系数表明UWTA的暖峰值发生在2-4月(FMA)。Walker环流的上升支受3-5月(MAM)WIO主导的暖湿空气垂直抬升的影响,但对流耦合Kelvin波(CCKWs)主要发生在FMA,对应比MAM更强的异常上升运动。进一步研究发现,FMA异常的上升运动主要受CCKWs影响,而在MAM,主要为WIO-SSTA增暖引起。异常上升通过非绝热加热使区域上空对流层中高层变暖,并通过强的正纬向温度平流异常平流到研究区域上空,导致UWTA。


Fig. 1. (a) The time series correlation coefficient between PC1 for EOF1 and normalized SST anomalies over the western Indian Ocean (WIO, 38°E-78°E, 20o S-3o N) (b) The lead-lag correlation coefficients between the three months running mean (i.e. 3-month means stepped one month at times) normalized SST anomalies depicted over the WIO and UWTA indices during MAM of 1980–2010. The month (−1) shows that SSTA indices lag the UWTA indices by one month (i.e. FMA) while month (0) shows the two are in phase during the current MAM season. Meanwhile, month (+1) denotes that SSTA indices lead the UWTA indices by one month (i.e. June–August, JJA).

Fig.2. The composite pattern for the 400–300-hPa mean zonal temperature advection anomalies  distribution fields for the difference between enhanced and suppressed SSTA during (a) FMA (b) MAM seasons of 1980–201. The hatched areas are statistically significant at 5% level with a two tailed Student's t-test.
相关成果已在《Atmospheric Research 》期刊上发表。
相关文献:
Causes of the upper-level warm temperature anomaly (UWTA) associated with March–May heavy rainfall in Tanzania