东亚冬季风(EAWM)是北半球冬季大气环流的显著特征,其跨度从中高纬度的东亚大陆到低纬度的西太平洋,干冷的低空偏北风会产生低温、寒潮等灾害性事件,引发各种社会、经济问题。最近的一些研究确定了EAWM的两种不同模态,不同纬度的EAWM模态相关的大气环流特征不同,相关的热带太平洋SST异常也不同。在全球变暖背景下,有必要分别讨论ENSO与EAWM南部和北部模态的不同联系。近日,我院郝鑫副教授与其硕士研究生过文箫等探讨了18个CMIP6模式模拟东亚冬季风及其与ENSO关系的性能,以及模式间偏差的可能原因,相关成果发表于《Climate Dynamics》。
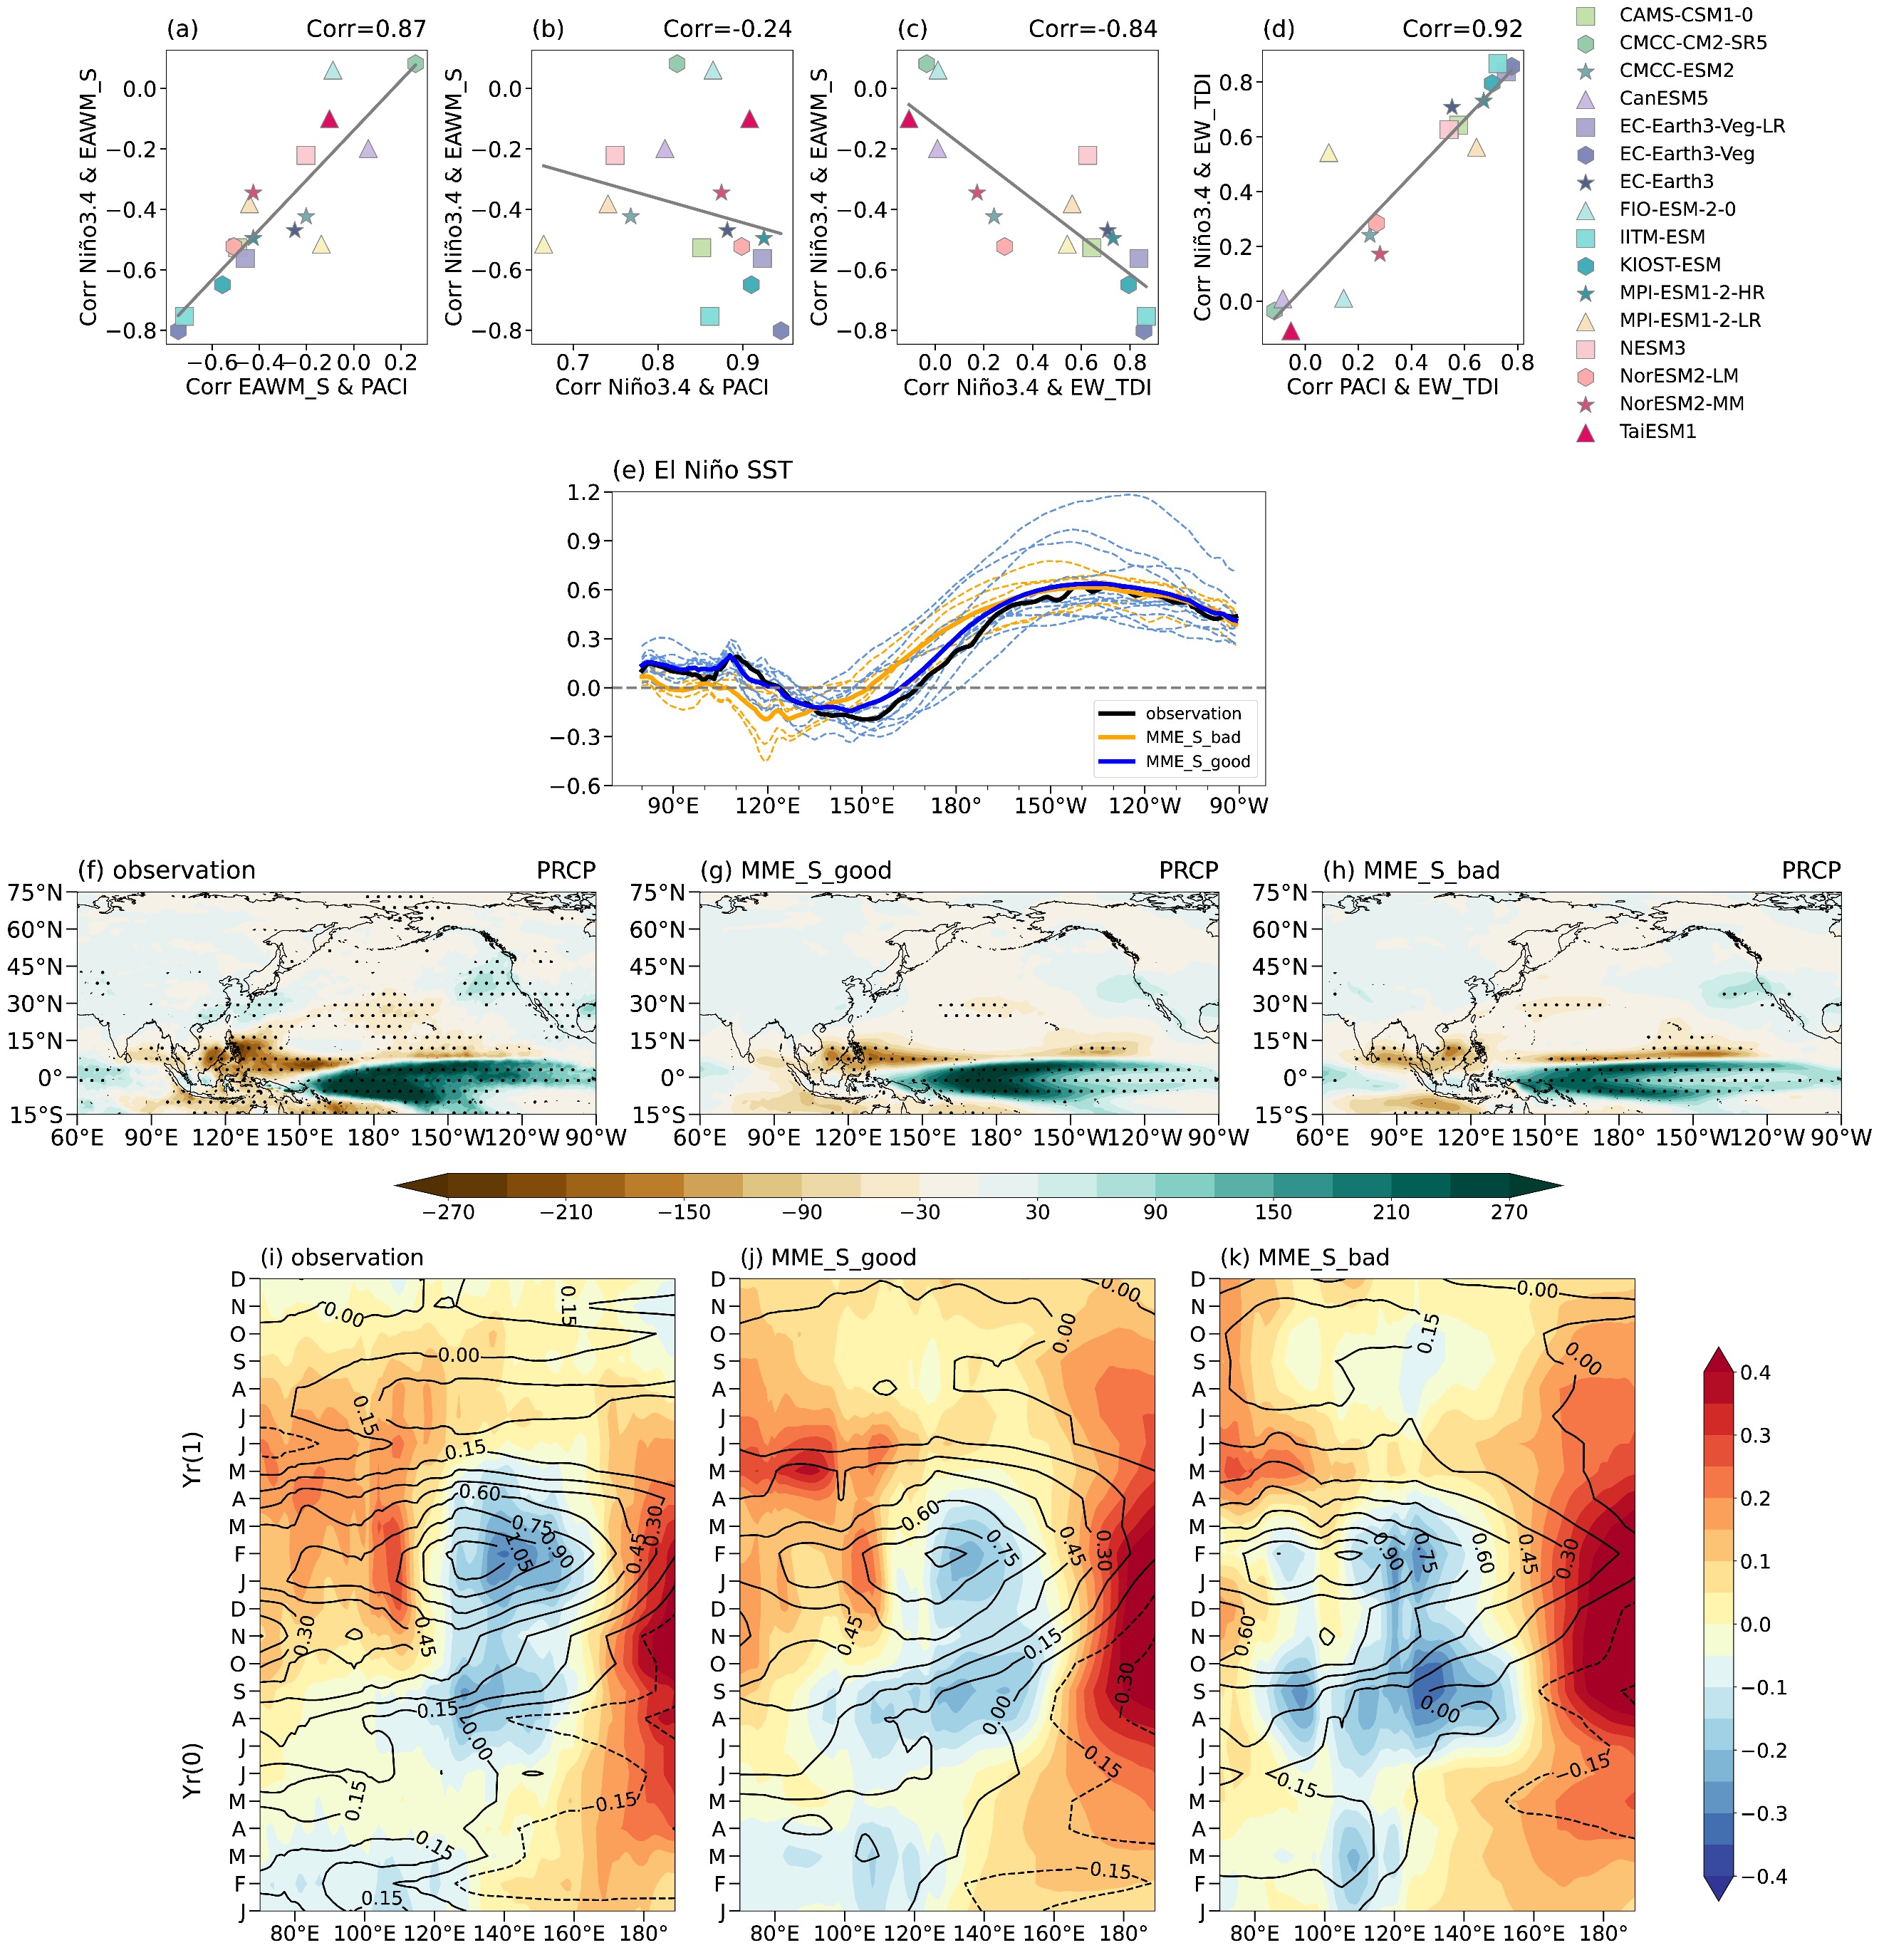
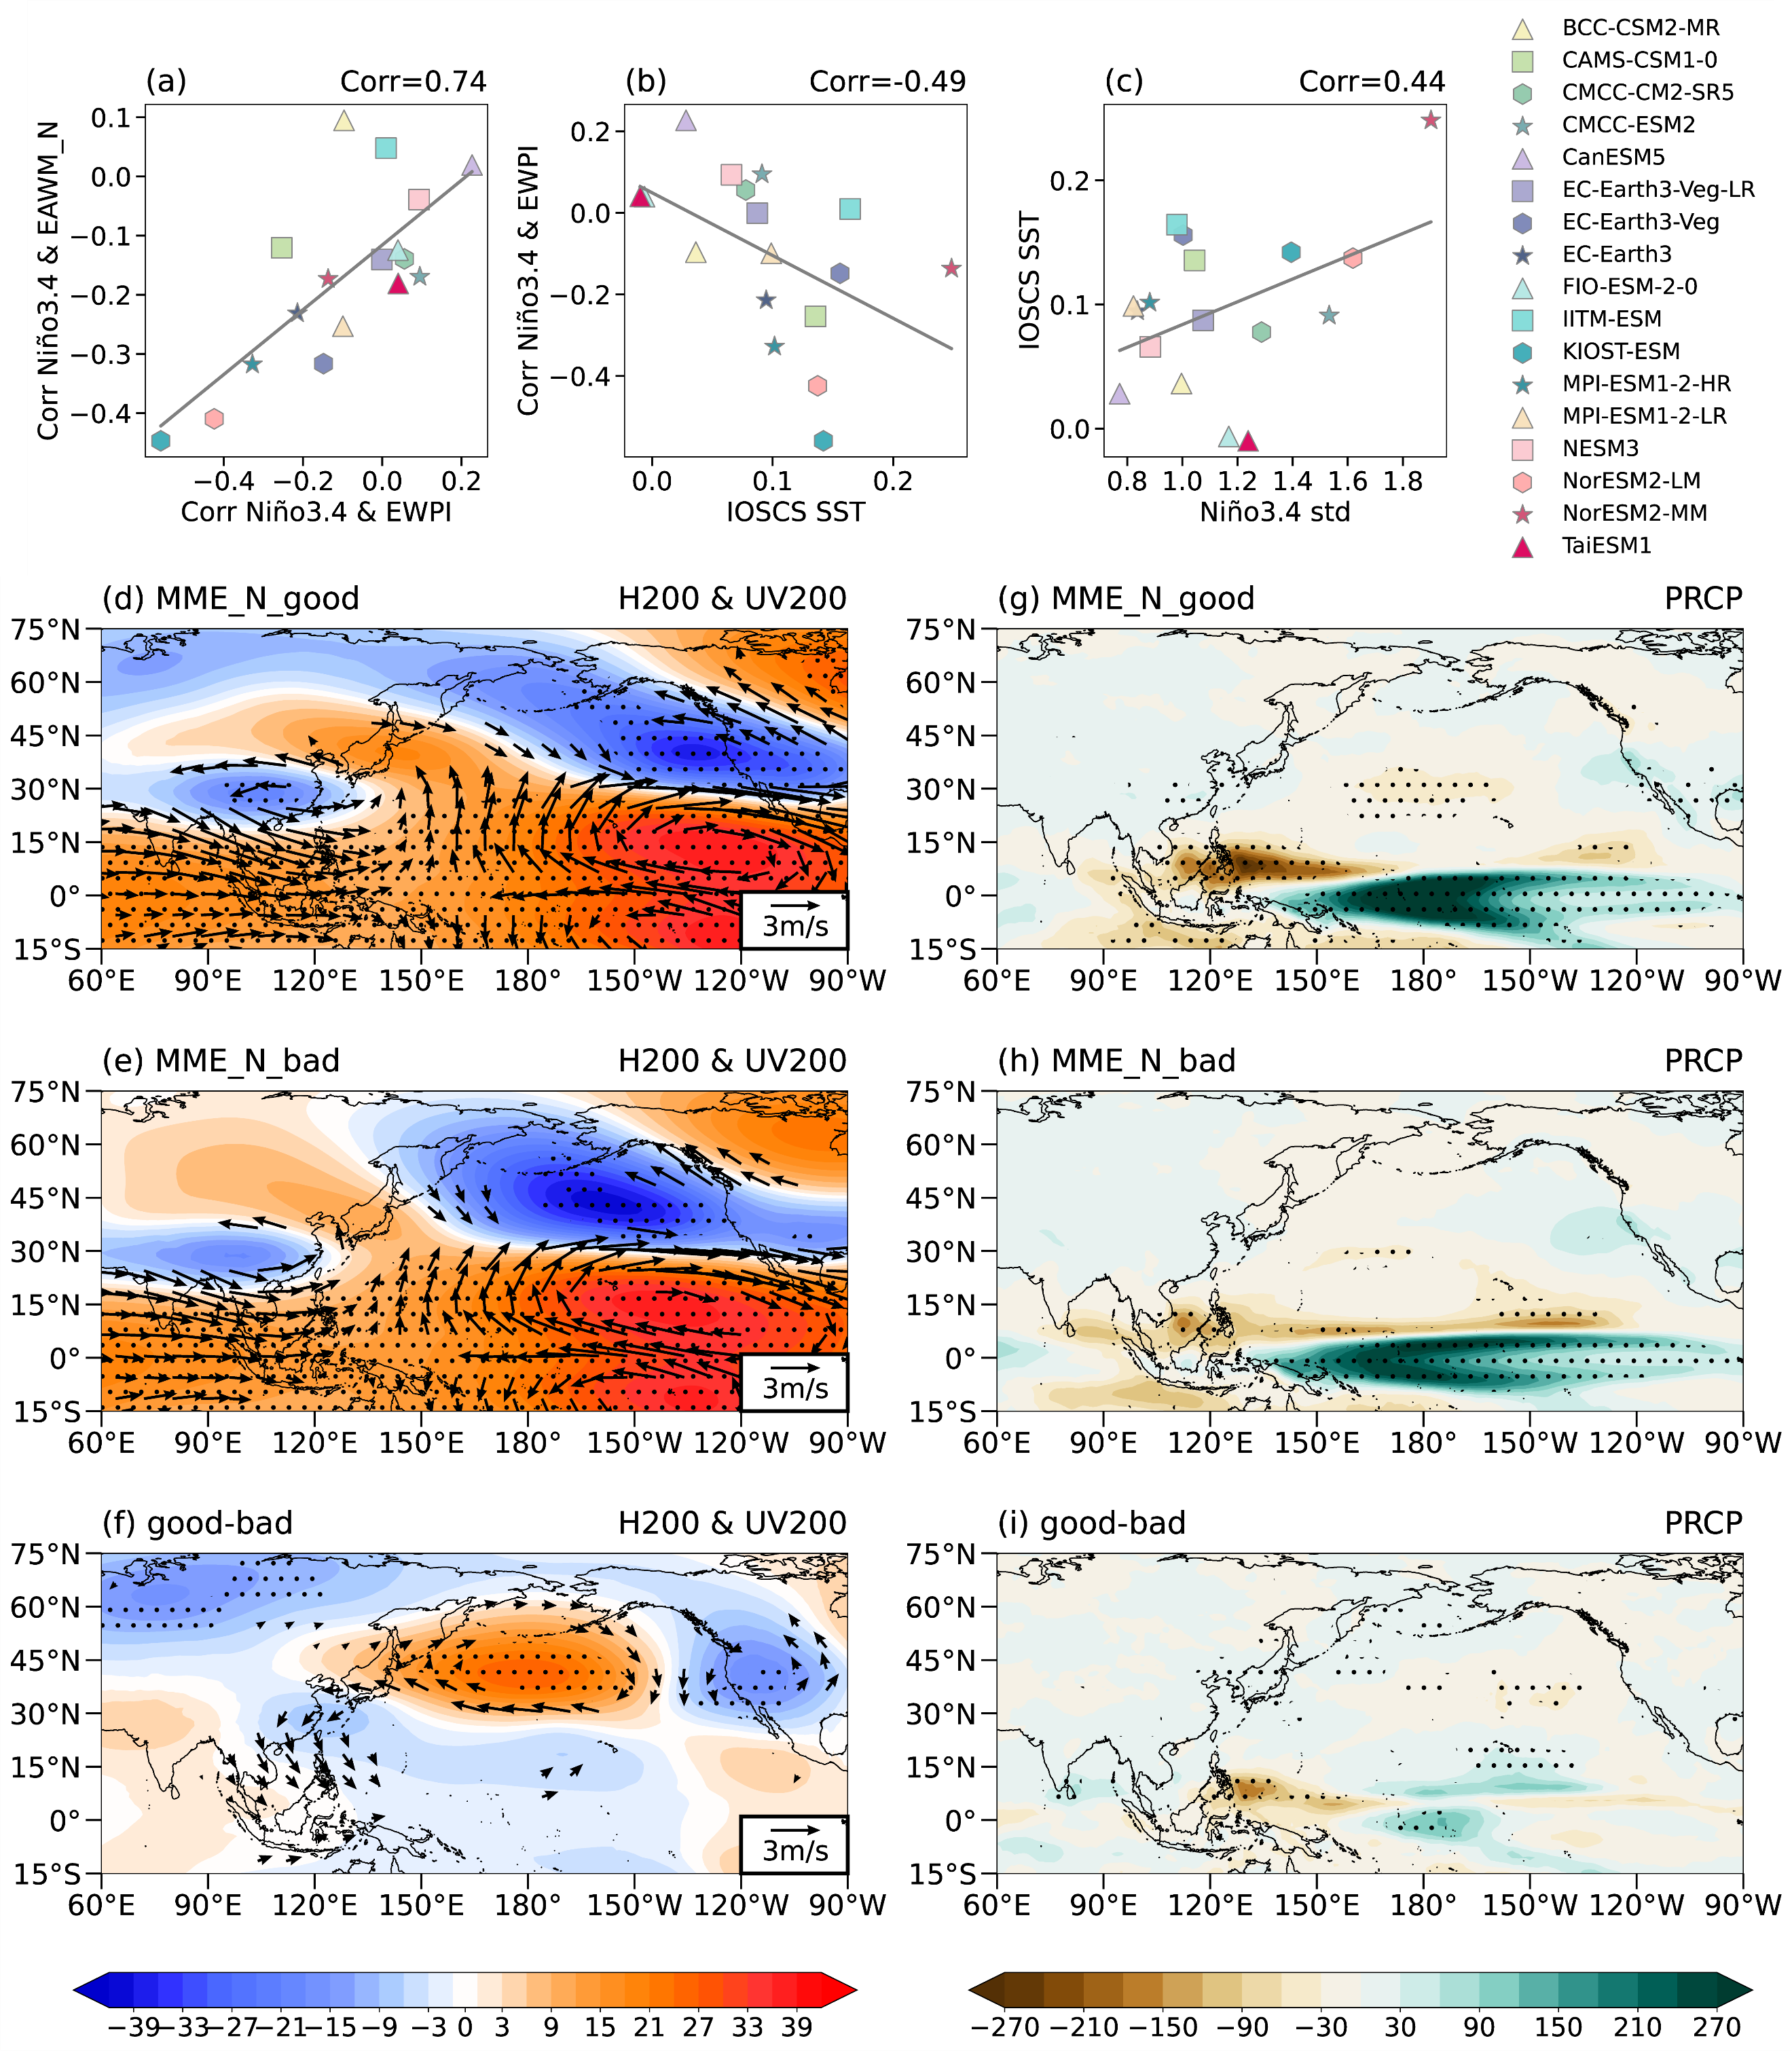
本研究基于模式是否能模拟出ENSO与EAWM的密切关系,将模式分为“性能较好”和“性能较差”组进行比较分析。对于EAWM南部模态,12个“性能较好”模式集合模拟结果表明,EAWM南部模态与ENSO之间的紧密关系取决于热带印度洋和太平洋上与ENSO相关的SST异常三极子模态的位置。菲律宾反气旋异常与海洋性大陆区域的纬向SST梯度间的热力学正反馈有利于中国东南部出现偏南风异常。对于EAWM北部模态,4个“性能较好”模式集合模拟结果表明,一方面,菲律宾反气旋的强度受ENSO变率强度的影响,这在一定程度上影响了模式模拟EAWM北部模态与ENSO关系的能力。较强的菲律宾反气旋异常能够使得异常偏南风从东亚的低纬度延伸到中高纬度。另一方面,EAWM北部模态与ENSO间的关系受到与ENSO相关的印度洋和南海SST异常的影响。较强的SST异常能够通过异常潜热诱发欧亚大陆上的向极地罗斯贝波,有利于异常黑潮反气旋的出现,从而增强东亚中纬度的偏南风异常。

Fig. 1. Scatterplots of correlation coefficients between the Niño 3.4 index and EAWM_S vs. (a) the correlation coefficient between EAWM_S and PACI, and (b) the correlation coefficient between Niño 3.4 and PACI, and (c) the correlation coefficient between Niño 3.4 and EW_TDI in 17 CMIP6 models. (d) Scatterplots of the correlation coefficient between Niño 3.4 and EW_TDI vs. the correlation coefficient between PACI and EW_TDI in 17 CMIP6 models. Values in the top right are the corresponding coefficients. Gray lines represent the linear fit of the relationship. (e) Mean SST (°C) anomalies along 10°S–20°N obtained by regression onto the Niño 3.4 index in the observations (black line), MME_S_bad (orange line), and MME_S_good (blue line). Blue and orange dashed lines denote the results of individual models in the S_good and S_bad groups, respectively. Regression of DJF total precipitation (mm) anomalies with respect to the Niño 3.4 index of the (f) observations and (g) MME_S_good and (h) MME_S_bad. The dotted areas denote anomalies that are significant at the 95% confidence level. Longitude–time diagrams of SST (shading, °C) and SLP (contours, hPa) anomalies averaged over 0°–12°N obtained by regression onto the Niño 3.4 index of the (i) observations and (j) MME_S_good and (k) MME_S_bad. The vertical axis is the lead–lag time (month) starting from January of the same year (Yr 0) to December of the following year (Yr 1).

Fig. 2. Scatterplots of (a) correlation coefficients between Niño 3.4 index and EAWM_N vs. correlation coefficients between the Niño 3.4 index and EWPI; (b) correlation coefficients between the Niño 3.4 index and EWPI vs. IOSCS SST anomalies; and (c) IOSCS SST anomalies vs. the Niño3.4 standard deviation for 17 CMIP6 models. Values in the top right are corresponding correlation coefficients. Gray lines represent the linear fit of the relationship. Regression of (d) 200-hPa geopotential height (shading, gpm) and wind (vector, m∙s−1), (g) DJF total precipitation (mm) anomalies with respect to the Niño 3.4 index in the MME_N_good. (e) and (h) as in (d) and (g), but in the MME_N_bad. Difference of MME_N_good and MME_N_bad for (f) 200-hPa geopotential height and wind, (i) total precipitation anomalies. Wind vector scales are shown in the bottom right. Black vectors and dotted areas denote anomalies that are significant at the 95% confidence level.
Reference:
Guo, W., Hao, X.*, Zhou, B., Li, J., and Han, T. Understanding the ENSO–East Asian winter monsoon relationship in CMIP6 models: performance evaluation and influencing factors. Clim Dyn 62, 7519–7534 (2024). https://doi.org/10.1007/s00382-024-07292-1